
CarInsurance.com Insights
- Average car insurance costs vary widely depending on coverage level, location, and individual driver risk factors.
- Full coverage costs significantly more than liability-only because it includes collision and comprehensive protection for your vehicle.
- Where you live heavily influences premiums due to state laws, claim frequency, weather risks, and repair costs.
- Personal details affect your rate including age, driving record, credit profile, vehicle type, and annual mileage.
- Comparing insurers is one of the fastest ways to save since companies price the same driver very differently.
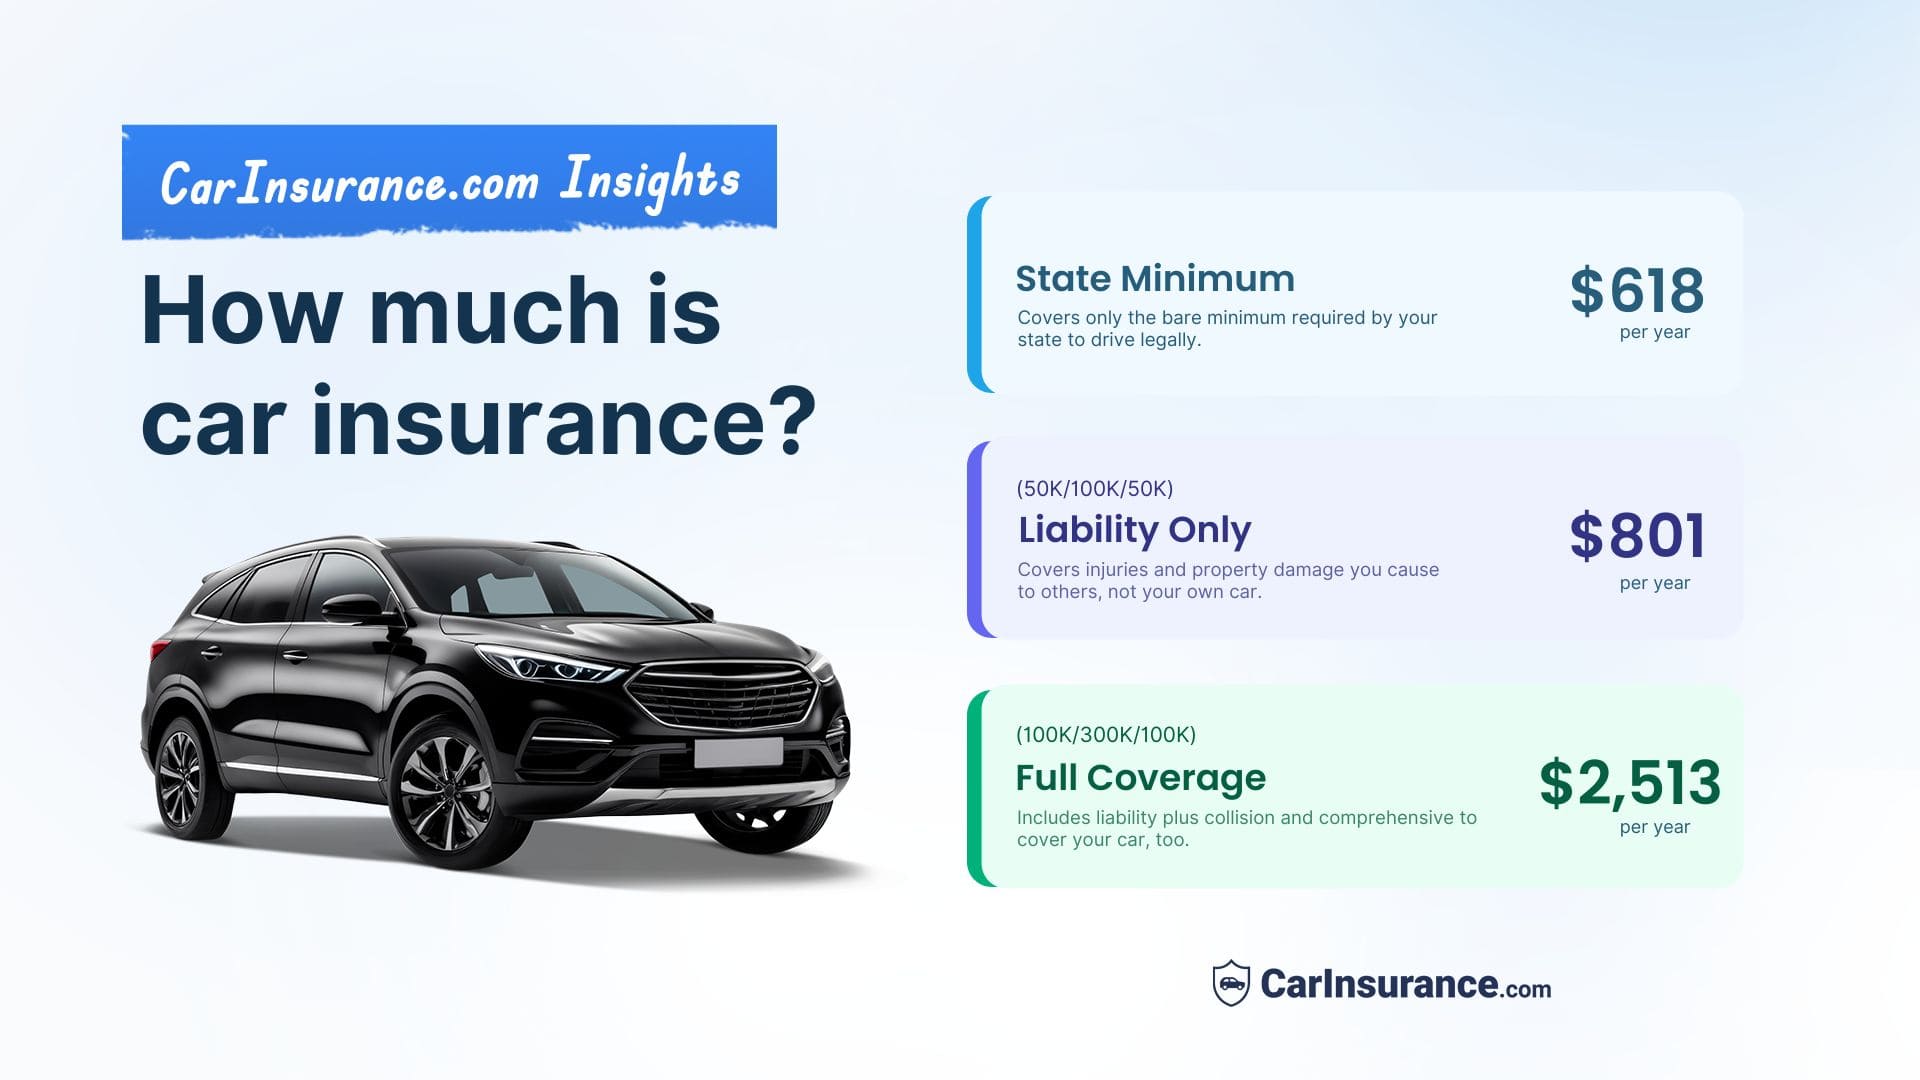
Car insurance remains a significant expense for drivers in 2026. The average cost of a full coverage policy is $2,513, while liability-only coverage averages $801 per year. Insurers weigh multiple factors to determine your rate, from where you live to your driving history.
In this guide, explore what car insurance costs in each state in 2026. Plus, see how rates vary by age, gender and vehicle type to help you make informed, budget-friendly coverage choices.
Average cost of car insurance in 2026
In 2026, the nationwide average cost of car insurance is $2,513 per year or $209 per month. CarInsurance.com editors recommend that most drivers carry full coverage insurance with limits of 100/300/100.
Empower your cost decisions with personalized data
Use the CarInsurance.com cost calculator below to find out how much you can expect to pay for car insurance based on your age and location. This tool gives you a fast, personalized estimate on car insurance rates so you can skip complex data and compare rates.
Select your state and age group, then tap “calculate” to find your estimated car insurance premium.
Car insurance cost calculator
Find out how much you'll pay for auto insurance coverage.
-
$1,200Low
-
$2,056Average
-
$3,751High
How much is car insurance per month?
The cost of car insurance will vary based on personal and vehicle risk factors. Insurers will consider your driving record, age, marital status and credit score, as well as the vehicle you are insuring.
The national average for full coverage with liability limits of 100/300/100 is $209 per month, but your premium may be higher or lower depending on the insurance company you choose and your personal risk factors. Liability-only coverage with limits of 50/100/50 is $67 per month, and the state minimum car insurance coverage averages $51 per month.
Average annual car insurance rates by coverage level
Car insurance rates vary depending on what coverages you are carrying and your coverage levels. Here is a breakdown of coverages and how they impact your premium:
- Full coverage: $2,513
- Liability only: $801
- State minimum: $618
Coverages: If you have a liability-only policy, your premium will almost always be less than full coverage. Liability-only policies will help cover medical and legal bills if you injure someone with your vehicle. It will also pay to repair the other person’s vehicle, but it doesn’t protect your car or cover your injuries.
Full coverage, on the other hand, offers liability protection as well as collision and comprehensive insurance. Collision insurance will pay to repair your vehicle after an accident. Comprehensive insurance will repair or replace your car if it is damaged or destroyed by something other than a collision; animal strikes, theft, vandalism, fire, or flood are all covered.
Coverage amounts: Your coverage levels also impact your premium. The higher your levels, the more you will pay for coverage, as your insurer is on the hook for a greater amount after a claim.
Deductibles: The higher your deductibles, the lower your premiums.
Speak with a friendly agent and get your quote in minutes!
How much does car insurance cost by company?
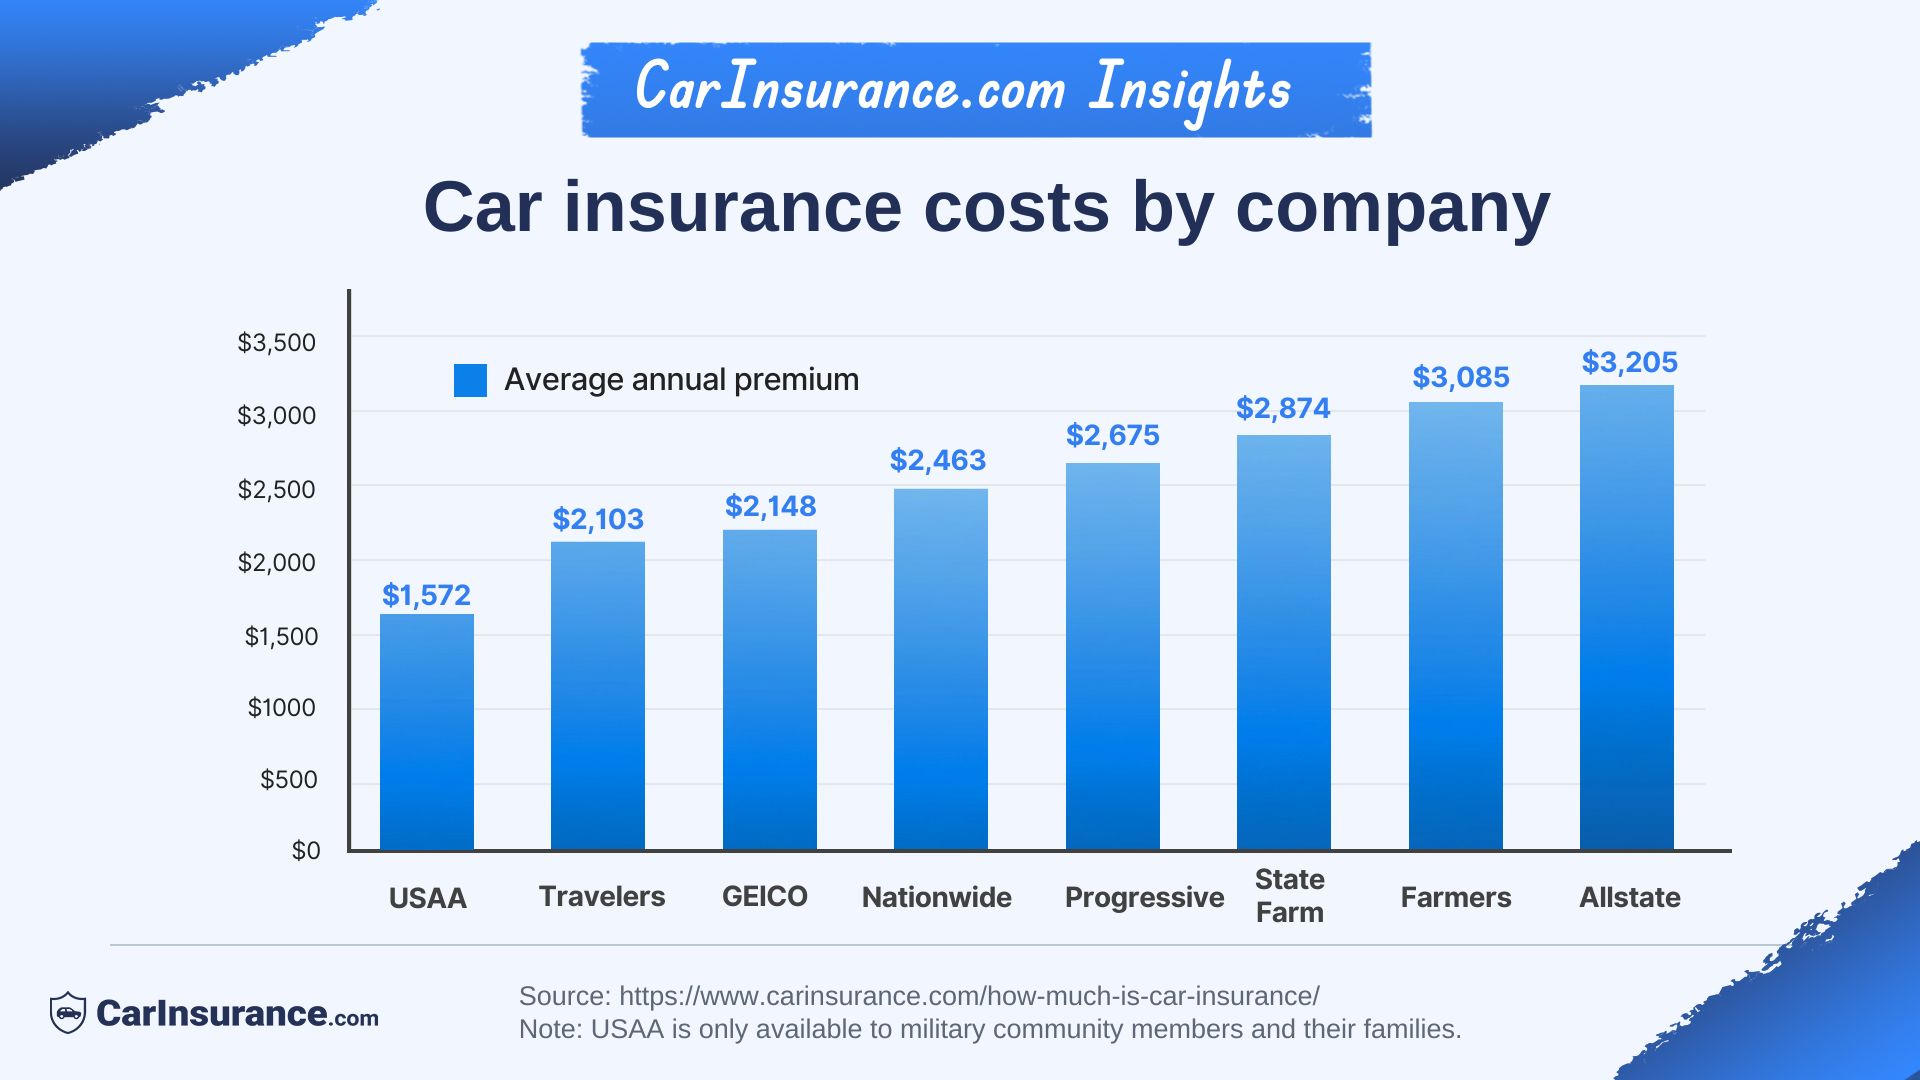
Insurance companies rate risk differently, which can result in dramatic differences in premium quotes. Insurers use proprietary algorithms, so your risk factors can push your rate up or down, depending on the company.
Travelers ($2,103) has the cheapest full coverage rates, while GEICO ($439) and Progressive ($620) have the cheapest annual state minimum car insurance rates.
Finding the right insurer can take some time and research, but shopping for your coverage regularly is one of the best ways to keep your premiums affordable. Shop around annually and always compare apples to apples regarding coverage levels and deductibles.
See monthly and annual rates for state minimum and full coverage in the table below.
| Company | State minimum annual rates | Full coverage annual rates |
|---|---|---|
| Allstate | $889 | $3,205 |
| Farmers | $816 | $3,085 |
| GEICO | $439 | $2,148 |
| Nationwide | $808 | $2,463 |
| Progressive | $620 | $2,675 |
| State Farm | $765 | $2,874 |
| Travelers | $680 | $2,103 |
| USAA | $363 | $1,572 |
Average cost of car insurance by state
Insurance laws are controlled at the state level, so car insurance rates vary dramatically between states. Various factors can impact rates, including weather, crime rates and state laws.
States like Vermont, New Hampshire and Maine have the cheapest car insurance while Louisiana, Florida and Washington, D.C. top the list of the most expensive states for car insurance.
Frequent severe weather will result in a higher average premium than in a state that rarely experiences storms. Crime rates will increase insurance premiums as insurers must cover the damages if your vehicle is stolen or vandalized.
Population density is also a factor: More cars equal more accidents. Dense urban centers tend to have higher crash rates than rural areas. We ran the numbers, and the average rates by state are in the table below.
| State | Annual full coverage rates | Monthly full coverage rates |
|---|---|---|
| Alaska | $2,215 | $185 |
| Alabama | $2,107 | $176 |
| Arkansas | $2,723 | $227 |
| Arizona | $2,333 | $194 |
| California | $3,010 | $251 |
| Colorado | $3,222 | $268 |
| Connecticut | $2,726 | $227 |
| Washington, D.C. | $3,394 | $283 |
| Delaware | $3,097 | $258 |
| Florida | $3,852 | $321 |
| Georgia | $2,739 | $228 |
| Hawaii | $1,721 | $143 |
| Iowa | $2,228 | $186 |
| Idaho | $1,791 | $149 |
| Illinois | $1,901 | $158 |
| Indiana | $1,856 | $155 |
| Kansas | $2,410 | $201 |
| Kentucky | $2,976 | $248 |
| Louisiana | $4,180 | $348 |
| Massachusetts | $2,430 | $203 |
| Maryland | $2,273 | $189 |
| Maine | $1,701 | $142 |
| Michigan | $3,146 | $262 |
| Minnesota | $2,561 | $213 |
| Missouri | $2,410 | $201 |
| Mississippi | $2,455 | $205 |
| Montana | $2,541 | $212 |
| North Carolina | $2,587 | $216 |
| North Dakota | $2,079 | $173 |
| Nebraska | $2,387 | $199 |
| New Hampshire | $1,650 | $137 |
| New Jersey | $2,736 | $228 |
| New Mexico | $2,486 | $207 |
| Nevada | $3,284 | $274 |
| New York | $2,898 | $241 |
| Ohio | $1,739 | $145 |
| Oklahoma | $2,705 | $225 |
| Oregon | $1,927 | $161 |
| Pennsylvania | $2,428 | $202 |
| Rhode Island | $2,706 | $225 |
| South Carolina | $2,367 | $197 |
| South Dakota | $2,635 | $220 |
| Tennessee | $2,214 | $184 |
| Texas | $2,631 | $219 |
| Utah | $2,250 | $188 |
| Virginia | $1,837 | $153 |
| Vermont | $1,504 | $125 |
| Washington | $2,175 | $181 |
| Wisconsin | $2,026 | $169 |
| West Virginia | $2,557 | $213 |
| Wyoming | $1,984 | $165 |
Select your state to see car insurance cost breakdowns
See how much the average cost of car insurance is for various levels of coverage in your state in the interactive table below.
Most expensive states for car insurance
Some states have much higher car insurance premiums than others. Rates can be impacted by location-specific factors like severe weather risks, the number of uninsured drivers, the frequency of insurance claims in the area and the crime rate. These are the five most expensive states for auto insurance:
- Louisiana: $4,180 per year
- Florida: $3,852 per year
- Washington, D.C.: $3,394 per year
- Nevada: $3,284 per year
- Colorado: $3,222 per year
States with the cheapest car insurance rates
Drivers in certain states may get a break on their auto insurance premiums. Here are the five cheapest states for car insurance:
- Vermont: $1,504 per year
- New Hampshire: $1,650 per year
- Maine: $1,701 per year
- Hawaii: $1,721 per year
- Ohio: $1,739 per year
Check out our detailed guide on car insurance rates by state.
Average car insurance cost by age and gender
Insurers consider your age and gender when setting a rate, and young male drivers tend to pay the highest rates. In most cases, car insurance is very expensive for young drivers. It levels out in your 20s and 30s and heads up again as you hit 70.
Teens are expensive to insure because they are inexperienced and tend to get in more accidents. According to the Insurance Institute for Highway Safety, the fatal crash rate per mile driven for 16- to 19-year-olds is nearly three times the rate for drivers ages 20 and over, with the risk being the highest for ages 16 to 17.
Rates start to drop in your 20s assuming you keep your record clean and will start to climb again when you hit your golden years. Senior rates tend to be higher as they are involved in more accidents and experience more injuries in accidents.
Gender also impacts your car insurance rates; in this case, men pay more. Statistics show that men are involved in more accidents and claims and typically pay higher rates. In most cases, the difference is not huge, with the most significant gap being between teen male and female drivers. In the table below, see the rates by age and gender.
Note that age and gender cannot be used as rating factors in all states, but most allow them.
| Age | Annual rates for females | Monthly rates for females | Annual rates for males | Monthly rates for males |
|---|---|---|---|---|
| 18 | $6,719 | $560 | $7,569 | $631 |
| 19 | $5,133 | $428 | $5,807 | $484 |
| 20 | $4,673 | $389 | $5,266 | $439 |
| 25 | $2,913 | $243 | $3,028 | $252 |
| 40 | $2,511 | $209 | $2,516 | $210 |
| 65 | $2,255 | $188 | $2,293 | $191 |
Average auto insurance rates by vehicle
The type of vehicle you drive will impact your insurance costs. Sport and luxury vehicles are almost always expensive to insure, while a minivan or sedan will be more affordable.
Below are a few of the more common vehicle types and where they fall when it comes to insurance costs:
- SUVs: SUVs are pretty reasonable to insure because they often do well in crash tests and they are popular, which helps lower repair costs as there are plenty of parts around. However, luxury SUVs can be pricey to insure due to their high sticker price and expensive trim materials, making repairs expensive.
- Sports cars: A sports car will almost always be more expensive to insure than a comparable sedan or SUV. Sports cars tend to have big engines, are often owned by more risky drivers and typically have a high sticker price and expensive repairs, all leading to sky-high insurance rates.
- Luxury vehicles: In general, the more expensive the vehicle, the higher the premium. Luxury vehicles are typically expensive and are loaded with costly technology and trim materials, making them expensive to repair. All of these factors mean your luxury vehicle will be much more expensive to insure.
- Electric vehicles: Electric vehicles are usually more expensive to insure than their gas counterparts. This is because they often have a higher sticker price, are packed with pricey technology and have a big, very expensive battery under the hood.
In the table below, see how much car insurance costs for a full coverage policy for various types of vehicles.
| Vehicle type | Annual cost | Monthly cost |
|---|---|---|
| Electric | $3,174 | $265 |
| Hatchback | $2,661 | $222 |
| Hybrid | $2,554 | $213 |
| Luxury Car | $3,497 | $291 |
| Luxury SUV | $2,960 | $247 |
| Minivan | $2,315 | $193 |
| Performance Car | $4,229 | $352 |
| Performance SUV | $3,586 | $299 |
| Sedan | $3,222 | $268 |
| Sports Car | $3,530 | $294 |
| Station Wagon | $2,375 | $198 |
| SUV | $2,553 | $213 |
| Truck | $2,669 | $222 |
| Van | $2,208 | $184 |
Use our new and used car tool to see how rates differ.
Ultimately, the vehicle’s market value is one of the most critical insurance rating factors.
“An old, used sports car could be cheaper to insure than a new minivan,” says Jim Brau, Joel C. Peterson Professor of Finance at Brigham Young University Marriott School of Business. “What matters is the value of the vehicle that is to be replaced if it is damaged. When vehicles are totaled, insurance companies are on the hook to pay the value of the vehicle. In general, the more expensive to replace the vehicle, the more expensive the insurance.”
The cheapest and most expensive cars for insurance
The cheapest cars to insure in 2026 are:
- Hyundai Venue
- Mini Cooper Electric
- Subaru Impreza
- Subaru Legacy
- Mini Cooper
The most expensive cars to insure in 2026 are:
- Maserati Quattroporte
- Maserati Ghibli
- BMW M8 Gran Coupe
- Audi RS7
- Mercedes-AMG EQS
How driving violations impact car insurance rates
Drivers with specific violations on their record pay higher rates for car insurance. Here are a few examples:
- If you receive a citation for distracted driving, your car insurance premium will increase by an average of 35%, resulting in a rate increase from $2,513 to $3,382 per year.
- If you are convicted of a DUI, your premium will increase by an average of 103%, resulting in a rate increase from $2,513 to $5,104.
- Two speeding tickets will increase your annual rate by 60%, resulting in a cost increase from $2,513 to $4,028 a year.
In the table below, you can see the average cost of auto insurance for specific traffic violations.
| Violation | Average annual premium | After violation | $ difference | % difference |
|---|---|---|---|---|
| 2 At-fault property damage accident over $2k | $2,513 | $5,614 | $3,101 | 123% |
| 2 comprehensive claims for over $2k | $2,513 | $3,318 | $805 | 32% |
| 2 speeding tickets 11 mph or over | $2,513 | $4,028 | $1,514 | 60% |
| Adding gap insurance | $2,513 | $2,592 | $79 | 3% |
| Adding rideshare endorsement | $2,513 | $3,057 | $544 | 22% |
| At-Fault Accident | $2,513 | $3,984 | $1,471 | 59% |
| Bad Credit | $2,513 | $5,466 | $2,953 | 117% |
| Careless driving | $2,513 | $3,802 | $1,289 | 51% |
| Claims | $2,513 | $2,963 | $450 | 18% |
| Distracted driving ticket | $2,513 | $3,382 | $869 | 35% |
| Driving without a license or permit | $2,513 | $3,425 | $912 | 36% |
| Driving without insurance | $2,513 | $3,288 | $775 | 31% |
| DUI | $2,513 | $5,104 | $2,591 | 103% |
| DUI/DWI second offense | $2,513 | $7,699 | $5,186 | 206% |
| Failure to stop | $2,513 | $3,302 | $788 | 31% |
| Failure to yield | $2,513 | $3,297 | $783 | 31% |
| Fair credit | $2,513 | $3,212 | $699 | 28% |
| Following too closely | $2,513 | $3,317 | $804 | 32% |
| Hit and run – injury | $2,513 | $5,148 | $2,634 | 105% |
| Hit and run – property damage | $2,513 | $4,945 | $2,432 | 97% |
| Improper turn | $2,513 | $3,304 | $791 | 31% |
| Improper/illegal pass | $2,513 | $3,305 | $792 | 31% |
| Lapse of coverage | $2,513 | $3,257 | $744 | 30% |
| Operating a vehicle in a race (highway racing) | $2,513 | $5,031 | $2,518 | 100% |
| Passing stopped school bus | $2,513 | $3,420 | $907 | 36% |
| Reckless driving | $2,513 | $4,811 | $2,298 | 91% |
| Seatbelt infraction | $2,513 | $3,325 | $811 | 32% |
| Single vehicle accident (so the drivers car only) | $2,513 | $3,926 | $1,413 | 56% |
| Speeding | $2,513 | $3,489 | $975 | 39% |
| SR22 Filing Only | $2,513 | $2,862 | $348 | 14% |
| SR22 with 1 DUI | $2,513 | $5,530 | $3,017 | 120% |
| Talking on cellphone ticket | $2,513 | $3,313 | $799 | 32% |
| Texting ticket | $2,513 | $3,321 | $807 | 32% |
 See how insurance rates vary based on your vehicle and ZIP code
Starting with the average annual premium of $1,895, you can use our tools and calculators to see how your premiums might vary based on your specific circumstances, such as our Insurance rates by car model tool, which we used to create the scenario below.
Your car insurance rate will be much higher — $3,281 per year — if you’re driving a Ford Mustang GT in Florida than that of a Ford Escape Active owner in Maine, who’ll pay $1,272 per year for the same coverage.
And that’s without the additional considerations of driver age, driving record and credit score.
Frequently Asked Questions: How much car insurance costs
What factors affect your car insurance cost?
Insurance companies will consider your personal risk factors and your vehicle. Your driving record, credit score, the neighborhood where the vehicle will be parked, and your age/gender/marital status are just a few of the factors they will consider.
Why are EVs expensive to insure?
Many electric vehicles are expensive, and their batteries are pricey. High-priced vehicles are more expensive to insure because your insurance company will have to pay to replace the vehicle if it is stolen or destroyed by a covered peril. In addition, the battery that powers an EV can be very pricey to replace or repair.
Why is car insurance so expensive for teens?
Age is one factor that insurers consider when setting your rate, and young drivers always pay the highest premiums. Insurers love statistics, and the data show that teen drivers are more involved in accidents and claims than older drivers. Since teens are involved in more claims, insurers will charge a higher premium for coverage.
How much should I be paying for car insurance?
Avoid overpaying for your car insurance coverage by researching average rates for your coverage level, age, location and other rating factors. If you suspect you’re paying too much with your current insurer, shop around to see how much you could save. Comparing quotes and applying discounts are effective ways to reduce your premiums.
Why is my car insurance higher than the average?
Your car insurance may be higher than average due to personal factors like your driving record, age, credit score, vehicle type and ZIP code. Insurers also raise rates in areas with more accidents, theft or severe weather.
How much should I budget for car insurance each month?
On average, U.S. drivers pay about $2,513 per year for full coverage car insurance. Liability-only coverage is cheaper, averaging $801 annually. Your exact cost depends on your profile and location.
What’s the cheapest type of car insurance I can buy?
The cheapest type of car insurance is state minimum liability coverage, which only meets your state’s legal requirements. While it lowers costs, it doesn’t protect your own car, so it may leave you with big out-of-pocket expenses after an accident.
How do insurance companies calculate my rate?
Insurers use factors like age, gender, driving history, vehicle type, mileage, credit score and ZIP code to calculate your premium. They also consider claim trends in your area and your chosen coverage levels and deductibles.
Will my rates go down as I get older?
Yes. Car insurance typically costs more for young drivers under 25, then decreases as you gain experience and maintain a clean record. Rates may rise again after age 70 due to higher accident risk.
Does car insurance cost more in cities than rural areas?
Usually, yes. Urban drivers often pay higher premiums because cities have more traffic congestion, accidents, theft, and vandalism. Rural areas tend to see fewer claims, so rates are often lower.
Can I really lower my rate by shopping around?
Yes. Comparing quotes from multiple insurers can save you hundreds of dollars each year. Rates vary widely between companies, even for the same driver profile, so get quotes every six months to a year.
Resources & Methodology
Methodology
CarInsurance.com editors collected rates from Quadrant Information Services for a 40-year-old male and female driver carrying a full coverage insurance policy with limits 100/300/100 and $500 comprehensive and collision deductibles. Read the detailed methodology for more information.
Get advice from an experienced insurance professional. Our experts will help you navigate your insurance questions with clarity and confidence.
Browse all FAQs