If you assume the drivers stuck in the longest commutes are also paying the most to insure their cars, the data says otherwise. Drivers in Stockton-Lodi, California — home to the worst commute in the country, where nearly one in five car commuters spends an hour or more getting to work — actually pay slightly less for full-coverage car insurance than the average Californian.
A CarInsurance.com analysis of U.S. Census Bureau data across 387 metro areas found almost no overlap between the cities with the longest drives and the ones with the priciest insurance.
The most expensive metro to insure, New Orleans-Metairie, LA, ranks a middling 175th for commute length, while Las Vegas has one of the lightest commute burdens in the country and the second-highest premiums. Mileage matters, but where you live — and what happens to cars there — matters more.

Which metro area has the worst commute in America?
Stockton-Lodi, California, has the longest commute in the country: 19.9% of commuters there spend an hour or more getting to work each way. That’s nearly one in five drivers, or about 57,800 people. That figure only includes people driving to work in a car, not a bus or train.
To give you the full picture, here are the top five cities with the worst commutes in the country, based on the share of drivers who commute at least 60 minutes each way:
- Stockton-Lodi, CA (19.9%)
- Lexington Park, MD (18.3%)
- Riverside-San Bernardino-Ontario, CA (17.7%)
- Merced, CA (17.2%)
- Winchester, VA-WV (16.9%)
Five of the top 10 worst-commute metros are in California: Stockton-Lodi, Merced, Modesto, Riverside-San Bernardino-Ontario and Vallejo.
Does a long commute increase your car insurance rate?
Having a long commute doesn’t necessarily raise your car insurance rate. At least, not in the way that most people would assume.
Drivers in the Stockton-Lodi, CA, metro pay an average of $3,505 per year for full-coverage car insurance, about 2% below the California statewide average of $3,570. That means the worst commute in the country doesn’t even have the highest premiums in the state.
In fact, nine of the 10 worst-commuting metros have lower premiums than their state’s average. For example, the Winchester metro area’s average is 3.6% higher than Virginia’s and 15.2% lower than West Virginia’s.
For most drivers, where you live tends to move your rate more than small changes in mileage. Insurers are typically more concerned with how much claims cost in the area and how often cars get stolen. While commute length is a consideration, it’s a small one.
There’s one big exception. New York-Newark-Jersey City, NY-NJ, has the 13th-worst commute in the country, and its average car insurance rate is more than 30% above the New York state average. So, while a metro with long commutes can have high insurance costs, it’s not always the case.
Commute time does factor into your premium, and reporting accurate mileage matters. But mileage alone doesn’t explain why the worst-commute map and the most-expensive-insurance map look so different.
“Your ZIP Code often has a bigger impact on your premium than the number of miles you drive,” said Shivani Gite, contributing researcher and writer at CarInsurance.com. “Insurers look at the risks tied to where your car is parked, including theft rates, accident frequency, repair costs and local claim trends. A longer commute can raise your risk, but the neighborhood you live in can have an even greater effect.”
Where car insurance actually costs the most
New Orleans-Metairie, LA, has the most expensive car insurance premiums at $5,449 per year for full coverage, yet its average commute time ranks 175th out of 387 metros.
Las Vegas-Henderson-North Las Vegas, NV, is another good example. It has one of the lightest commute burdens, ranking 371st out of 387 metros, but it’s the second-most expensive metro for car insurance at $4,928 per year.
“Florida and Louisiana have been among the costliest states for auto insurance for many years due to the impacts of legal system abuse. Both states rank highest for percentage of litigated auto claims, according to the Insurance Research Council,” said Mark Friedlander, senior director of media relations for the Insurance Information Institute (Triple-I). “However, tort reform measures to reduce excessive volumes of lawsuits being filed by billboard attorneys have led to rate reduction filings by dozens of insurers over the past two years across both states. Florida has seen the most rate relief of any state since the start of 2025.”
Ohio and other Midwest metros sit at the other end. Sandusky, OH, has the least expensive premiums in the country at $1,528 per year, which is less than a third of the cost in New Orleans.
Commute rankings track time on the road; insurance prices track local claim costs and theft.
Speak with a friendly agent and get your quote in minutes!


Where are America’s hour-plus commutes?
Most of the areas where drivers are commuting more than an hour aren’t big cities. For example, Lexington Park, MD, ranks second, and Hammond, LA, is seventh. The data shows that smaller metros often have some of the longest commute times.
You might be surprised to see that the New York City metro ranks 13th, and the Washington, D.C., metropolitan area ranks 12th. That’s because so many people in these metros don’t drive at all. Remember, this data looks only at car commuters, not those who ride the bus or take a train to work.
The table below shows the top 15 metros by share of drivers who commute 60 minutes or more one way.
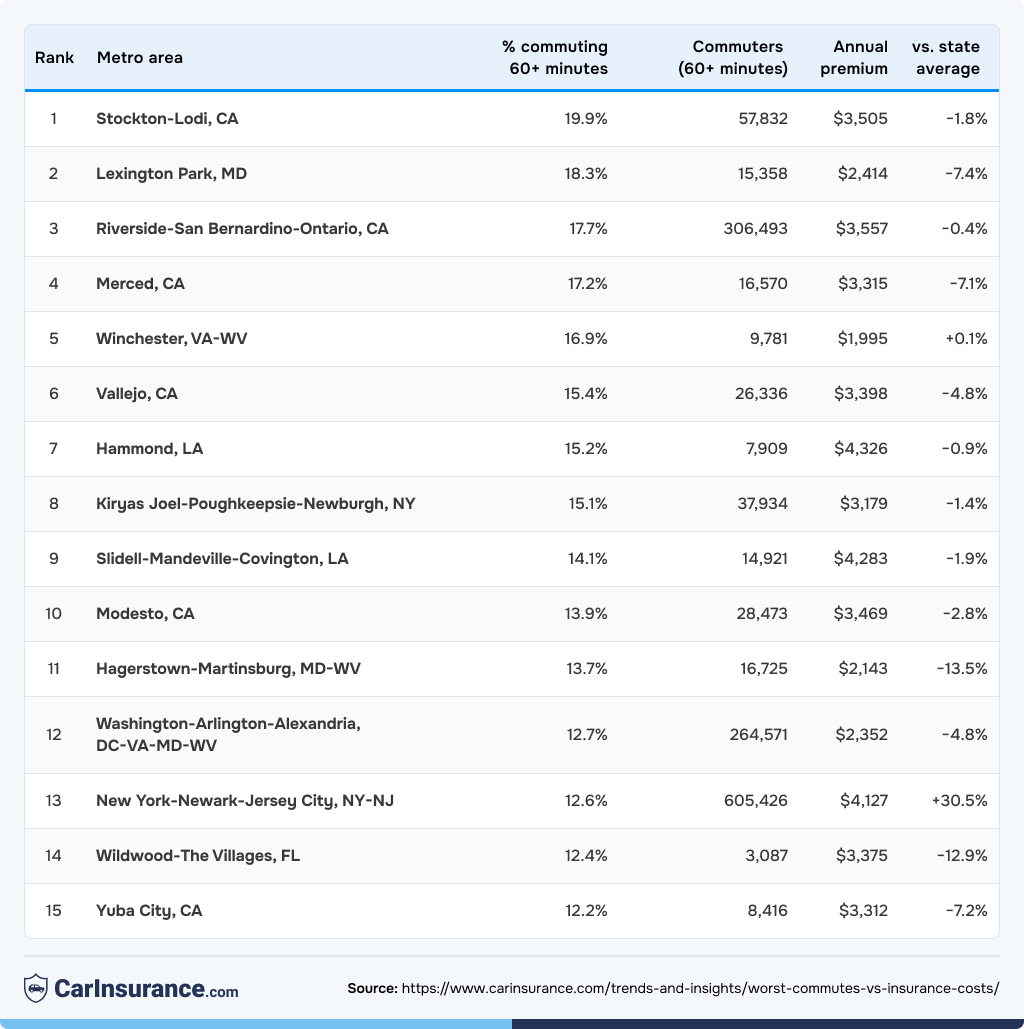
Within the top 15, eight metros cross the 15% threshold for hour-plus commutes. The majority of metros have a moderate or light commute, where 2.3% to 8% of car commuters spend more than an hour on the road.
Rates vary from ZIP code to ZIP code within the same metro. Look up average rates for your ZIP code using CarInsurance.com’s calculator to see what you can expect to pay for car insurance.
Have commutes actually gotten worse?
Commutes have gotten slightly worse in about two-thirds of the metros analyzed nationally, though not dramatically. Among the 318 metros that can be fairly compared over time, 208 got worse and 110 improved. The typical metro’s share of hour-plus commuters rose roughly 0.3 percentage points, from about 4.7% to 5.0%. The direction is remarkably consistent; the movement is mild.
That said, some metros are seeing longer commute times. The areas with the fastest-growing commutes are Sun Belt metros, such as Sierra Vista-Douglas, AZ; Killeen-Temple, TX; Punta Gorda, FL; and Cape Coral-Fort Myers, FL.
The areas where commute times are easing are Santa Cruz-Watsonville, CA; Hammond, LA; Washington-Arlington-Alexandria, DC-VA-MD-WV; Honolulu, HI; and two that might surprise you — San Jose-Sunnyvale-Santa Clara, CA, and Los Angeles-Long Beach-Anaheim, CA.
Several of these metros are hubs with large remote or hybrid workforces. It’s a pattern worth noting in the data, but it doesn’t entirely explain why workers are spending less time commuting.
Carpooling won’t get you home any faster
Here’s a surprising finding: in most metros, carpoolers are more likely than solo drivers to have an hour-plus commute.
In a typical metro, 7.8% of carpoolers commute 60 minutes or more each way, against 5.9% of solo drivers. Carpoolers fare worse in 318 of the 387 metros. That likely says more about who carpools than about carpooling itself: people tend to share a ride when the trip is already long, and pickups and drop-offs add time on top.
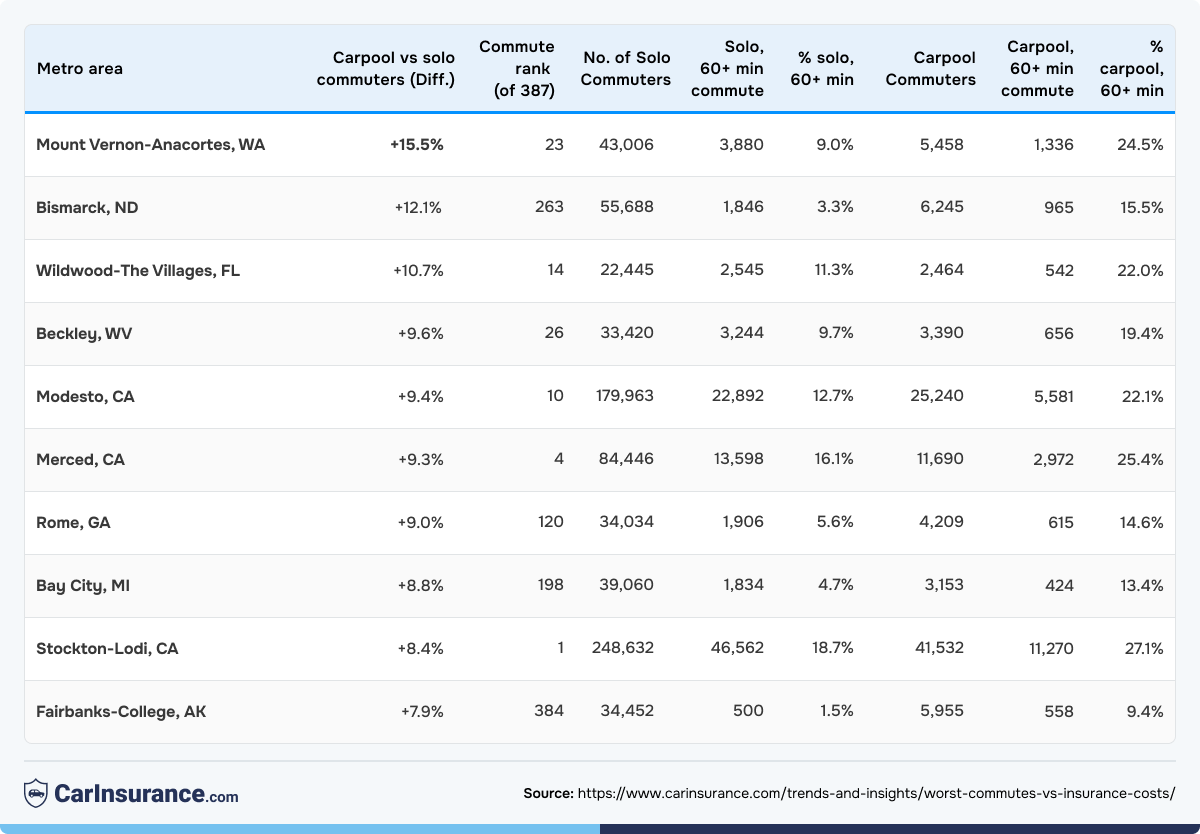
The widest gap is in Mount Vernon-Anacortes, WA, where 24.5% of carpoolers face an hour-plus commute, against 9% of solo drivers. Bismarck, ND, and Wildwood-The Villages, FL, show the next-widest splits. In Bismarck, 15.5% of carpoolers have a 60-plus-minute drive compared with 3.3% of solo drivers.
See the largest gaps between carpoolers and solo drivers in the table below.
How much does the drive cost you at the pump?
For a 21.2-mile round-trip commute, 250 days a year (five days a week, 50 weeks), at 27.2 mpg, the estimated fuel cost is roughly $823 per year at the national average gas price from AAA (note that the AAA benchmark is regular-grade fuel and was calculated for the week of Sept. 9, 2026). But the cost of your commute varies significantly depending on where you live.
For that same commute, California drivers pay an estimated $1,146 per year for fuel, whereas Indiana drivers pay an estimated $679 per year, a difference of $467. Indiana has the lowest fuel cost because the state has suspended its fuel tax through October 6, 2026.
Other states at the higher end of the fuel-cost spectrum are all western states: Washington, Hawaii, Oregon, Alaska, Nevada and Idaho. On the other end of the spectrum, Mississippi, Texas, Louisiana, South Carolina, Kansas, Oklahoma, Tennessee and Kentucky have the lowest fuel costs by state.
These figures are just estimates of a standard commute, not the actual cost a car commuter might incur. The commute distance is the same across all states, so the cost difference comes down to gas prices, not to how far people drive to work.
The metros with the easiest drives in America
If you live in a mid-sized Midwest metro, you might have one of the easiest commutes in the country. Sioux City, IA-NE-SD, has the lightest commute burden, where only 2.3% of car commuters travel 60 minutes or more.
Sioux Falls, SD-MN; Lima, OH; Fairbanks-College, AK; Wichita, KS; Omaha, NE-IA; and Des Moines-West Des Moines, IA also rank for quick commutes. Several of the Midwest metros also have cheap car insurance premiums. Lima, OH, is among the least expensive metros in the U.S. for car insurance.
What you can actually do about it
You probably can’t shorten your commute. You can make sure it isn’t quietly costing you extra:
- Check the annual mileage listed on your policy. If it’s wrong, you might be overpaying for coverage.
- Tell your insurer if your driving has changed. For example, if you get a new job or switch to a hybrid schedule, you might qualify for new discounts.
- Compare quotes if you drive a lot. Insurers weigh mileage differently, so comparing quotes can help you find the cheapest policy for your driving habits.
- Ask about low-mileage or usage-based policies. These types of car insurance can be cheaper if you actually drive less than average.
Final thoughts
While your commute time doesn’t translate directly into higher rates, spending more time driving raises your statistical chance of getting into an accident, Friedlander said.
“Driving during peak rush hours or low-visibility times like dawn and dusk increases vulnerability to collisions. Driver fatigue and the stress of a long commute also raises accident risk,” he said. “The specific premium impacts vary by driver profile based on typical rating factors including driving record, age, gender, location, credit history, vehicle type, coverages and deductibles.”
Sources
- U.S. Census Bureau. “ACS 2020-2024 5-year, Table B08134 (Means of Transportation to Work by Travel Time to Work).” Accessed September 2026.
- U.S. Census Bureau. “ACS 2015-2019 5-year, Table B08134.” Accessed September 2026.
- U.S. Census Bureau. “2024 ACS 1-year, Table B08134.” Accessed September 2026.
- U.S. Census Bureau. “Census Data API.” Accessed September 2026.
- OMB/U.S. Census Bureau. “Metropolitan and micropolitan delineation files, July 2023.” Accessed September 2026.
- HUD. “USPS ZIP Code Crosswalk, CBSA-ZIP.” Accessed September 2026.
- AAA. “State gas price averages, all four grades (regular, mid-grade, premium, diesel) daily September 9, 2026 snapshot.” Accessed September 2026.
- Tax Foundation. “State gasoline tax rates.” Accessed September 2026.
- U.S. EIA. “Weekly retail gasoline and diesel prices, week of August 31, 2026.” Accessed September 2026.
Methodology
CarInsurance.com commissioned Quadrant Information Services to calculate insurance rates using sample profiles of 40-year-old male and female drivers carrying full coverage with 100/300/100 liability limits and $500 collision and comprehensive deductibles. Metro rates are the average of residential ZIP code rates within each metro. State averages include rural ZIP codes, which puts the typical metro about 5% below its state figure.
Commute data comes from the U.S. Census Bureau’s American Community Survey; 387 metropolitan areas are ranked by the share of car, truck and van commuters with one-way commutes of 60 minutes or longer; remote workers are excluded.
To identify trends, we compared 2020-2024 with 2015-2019 for metro areas with unchanged boundaries. Because remote workers are excluded, a metro can improve when long-distance commuters stop commuting, rather than because drives get shorter.
Fuel-cost estimates apply AAA state-average prices for regular gasoline as of Sept. 9, 2026, to a standardized 21.2-mile round trip, 250 commuting days and 27.2 mpg, so differences reflect pump prices rather than distance driven. Indiana’s figure reflects a state gas tax suspension in effect at the time of publication.

 Still have a question? Ask our experts
Get advice from an experienced insurance professional. Our experts will help you navigate your insurance questions with clarity and confidence.
Browse all FAQs