CarInsurance.com Insights
- Winchester, Nevada, has the highest average car insurance rate, at $5,778 per year.
- Findlay, Ohio, has the cheapest average rates, at $1,449 per year.
- All 25 of the cheapest cities are in Ohio, indicating that the Buckeye state has some of the most affordable rates in the country.
- The most expensive cities are in Nevada and Louisiana, with the priciest rates clustered around Las Vegas and New Orleans.
- Even within a single state, prices can swing by more than $1,100.
Your city and ZIP code play an important role in your car insurance rate. Rates can vary by $2,900 or more between towns in the same state, reflecting differences in traffic density, accident frequency, crime rates, weather risks and local insurance laws.
Drivers in greater Las Vegas, Metro Detroit and the parishes surrounding New Orleans pay the highest average rates in the country, while residents of Northwest Ohio pay the lowest.
We analyzed these local patterns to show you the sharp divide between the most and least expensive U.S. cities for car insurance. See how your city’s average car insurance costs compare and what factors drive a city’s average rate.

Which cities have the most expensive car insurance?
Louisiana and Nevada have 17 of the top 25 most expensive cities for car insurance, with Winchester, Nevada, at No. 1 at an average rate of $5,778. The only other states in the top 25 are Michigan and Florida, each with four cities. Just three urban clusters drive most of the country’s top rates: Las Vegas, New Orleans, and Detroit.
Cities ringing Louisiana’s New Orleans metropolitan area, like Harvey, Terrytown and Marrero, have seen premiums inflated by a high risk of natural disasters like hurricanes, significant urban congestion and a high rate of lawsuits.
In Michigan, cities like Dearborn and River Rouge, both Detroit suburbs, have some of the highest rates in the nation, primarily due to a no-fault insurance system and high rates of uninsured drivers and vehicle theft. High rates persist even after the state’s 2019 car insurance reform law, which allowed drivers to choose a level of Personal Injury Protection (PIP).
These factors create a challenging financial environment for drivers, making car insurance a significant burden that often exceeds the national average.
These are the top five most expensive census-designated places for car insurance:
- Winchester, NV: $5,778
- Sunrise Manor, NV: $5,714
- Harvey, LA: $5,457
- Terrytown, LA: $5,446
- Redford, MI: $5,440
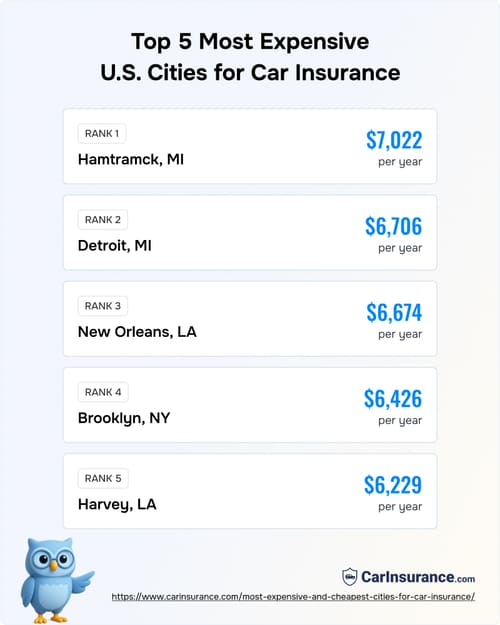

The table below shows the 25 most expensive cities for car insurance in the U.S.
| Rank | City, state | Annual premium |
|---|---|---|
| 1 | Winchester, NV | $5,778 |
| 2 | Sunrise Manor, NV | $5,714 |
| 3 | Harvey, LA | $5,457 |
| 4 | Terrytown, LA | $5,446 |
| 5 | Redford, MI | $5,440 |
| 6 | Whitney, NV | $5,419 |
| 7 | Spring Valley, NV | $5,410 |
| 8 | Egypt Lake-Leto, FL | $5,400 |
| 9 | Violet, LA | $5,392 |
| 10 | River Rouge, MI | $5,390 |
| 11 | Arabi, LA | $5,388 |
| 11 | Paradise, NV | $5,388 |
| 13 | Marrero, LA | $5,363 |
| 14 | Chalmette, LA | $5,330 |
| 15 | Nellis AFB, NV | $5,328 |
| 16 | Gretna, LA | $5,294 |
| 17 | Oak Park, MI | $5,293 |
| 18 | Meraux, LA | $5,287 |
| 18 | Waggaman, LA | $5,287 |
| 20 | North Miami Beach, FL | $5,270 |
| 21 | Hallandale Beach, FL | $5,242 |
| 22 | St. Bernard, LA | $5,227 |
| 23 | Dearborn, MI | $5,213 |
| 24 | Lauderhill, FL | $5,198 |
| 25 | Las Vegas, NV | $5,196 |
Which cities have the cheapest car insurance?
All 25 cities with the cheapest car insurance are in Northwest Ohio, most within about an hour of each other. Findlay, Ohio — a stone’s throw from Detroit, just about 100 miles to the south — has the country’s cheapest average car insurance rates at $1,449 per year. Not far is Van Wert, on the Indiana-Ohio line, which sees average rates of $1,469 per year, just $1.67 per month higher.
Ohio’s cheap average car insurance rates owe a lot to the state’s balanced mix of urban and rural roadways, with low congestion contributing to cheap rates. Many of the cheapest “cities” on our list, like Ottawa, are actually villages: state-designated municipalities with fewer than 5,000 residents. Even some of the cities are low-density, such as St. Marys, which has a population of about 8,400.
Here are the cheapest U.S. cities for car insurance in 2026:
- Findlay, OH: $1,449
- Van Wert, OH: $1,469
- Fremont, OH: $1,471
- Ottawa, OH: $1,479
- St. Marys, OH: $1,480
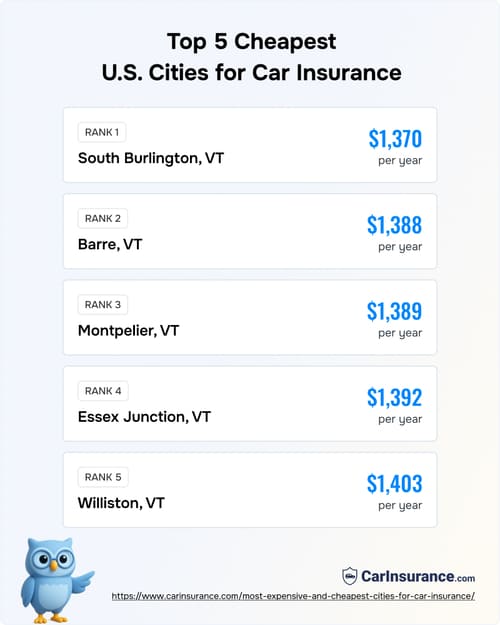

The table below shows the 25 cheapest U.S. cities for car insurance.
| Rank | City, state | Annual premium |
|---|---|---|
| 1 | Findlay, OH | $1,449 |
| 2 | Van Wert, OH | $1,469 |
| 3 | Fremont, OH | $1,471 |
| 4 | Ottawa, OH | $1,479 |
| 5 | St. Marys, OH | $1,480 |
| 6 | Clyde, OH | $1,485 |
| 7 | Coldwater, OH | $1,495 |
| 7 | New Knoxville, OH | $1,495 |
| 9 | Middle Point, OH | $1,499 |
| 10 | Bluffton, OH | $1,501 |
| 11 | Ohio City, OH | $1,503 |
| 12 | New Bremen, OH | $1,504 |
| 13 | Pandora, OH | $1,506 |
| 14 | Celina, OH | $1,508 |
| 15 | Tiffin, OH | $1,509 |
| 16 | Rawson, OH | $1,510 |
| 17 | Convoy, OH | $1,511 |
| 18 | Mount Cory, OH | $1,513 |
| 19 | Delphos, OH | $1,514 |
| 20 | Van Buren, OH | $1,515 |
| 21 | Leipsic, OH | $1,517 |
| 22 | Mendon, OH | $1,518 |
| 23 | Fort Recovery, OH | $1,520 |
| 23 | Green Springs, OH | $1,520 |
| 23 | McComb, OH | $1,520 |
Explore the most and least expensive cities in your state
Even in the same state, average rates can vary by thousands of dollars. Choose your state using the comparison tool below to see the 10 cities where drivers pay the least, and the 10 where they pay the most. Check before you comparison shop to see what to expect.
Rates shown are annual full coverage averages for a 40-year-old driver, based on data from Quadrant Information Services. State and national averages are calculated separately from the city figures and will not match a simple average of the cities listed.
Sophie’s Tip
If you are paying higher car insurance premiums, it may be a good time to review your coverage and consider switching insurers. Sophie, CarInsurance.com’s official mascot, can guide you through a step-by-step process to switch car insurance, making the process simpler and more manageable.
Speak with a friendly agent and get your quote in minutes!


What drives insurance rate differences across U.S. cities?
Car insurance rates vary widely across the U.S. Your location — down to your ZIP code — is one of the most significant factors in determining your premium.
Insurance companies use various data to assess a driver’s risk in a particular area. The risk is directly reflected in the cost of coverage.
Key factors driving car insurance rate differences across U.S. cities include:
- Population and traffic density: Cities with high population and heavy traffic congestion face a higher risk of accidents. More cars on the road lead to more opportunities for collisions, fender-benders and other incidents. The increased risk of claims translates to higher premiums for drivers in urban areas.
- Crime rates: Insurers analyze local crime statistics, particularly those related to vehicle theft and vandalism. If your city or neighborhood has a high rate of these crimes, your comprehensive coverage premiums will be higher to account for the increased likelihood of a claim.
- Cost of living and repair: The cost of labor, medical care and auto parts varies from city to city. In areas with a high cost of living, the expenses associated with a car accident — from vehicle repairs to medical bills — are higher. Insurance companies factor these costs into their premiums to ensure they can cover a potential claim.
- Weather and natural disasters: Cities prone to extreme weather events like hurricanes, floods, hailstorms or severe winter storms face higher insurance rates. Natural disasters increase the risk of vehicle damage, leading to a higher volume of insurance claims and, consequently, higher premiums.
- Local laws: State and local laws also play a role. Some states have higher minimum coverage requirements, which can drive up premiums. States with no-fault insurance laws often have higher rates because insurers must pay for medical expenses regardless of who is at fault for the accident.
“Most of the considerations are risk,” says Janet Ruiz, director of strategic communications for the Insurance Information Institute. “If there are more severe accidents or (increased) accident frequency in your area, you’re exposed to more risk. Your driving miles are your personal risk priced into your policy.”
Rate gap: The car insurance divide between U.S. cities
The widest gap between cities is $1,166 — the difference between Brooklyn, New York, and Newark, New Jersey. This divide reflects insurers’ risk calculations based on location and a driver’s environment, not just their driving record.
The reasons for high rates in densely populated urban centers are multifaceted. More cars on the road increase the risk of accidents, from fender-benders in rush-hour traffic to collisions in congested intersections.
City life comes with higher rates of vehicle theft and vandalism, which impacts the cost of comprehensive coverage. Insurers also account for the cost of living — expensive cities have higher labor costs for repairs and inflated medical expenses after an accident, all of which get factored into a driver’s premium.
Drivers in smaller towns or rural areas often benefit from significantly lower premiums. With less traffic and fewer vehicles, the probability of an accident is lower. These areas also tend to have lower crime rates and a more manageable cost of living, reducing the potential expense of claims.
While small-town drivers face other risks, such as extreme weather events, their overall risk profile is often more favorable, resulting in substantial savings. The geographic disparity highlights how a driver’s ZIP code can be as influential as their driving history in determining the final price of their policy.
Rate gap: Brooklyn, NY vs. Newark, NJ
The difference in car insurance costs between Brooklyn and nearby Newark is sharp. Newark drivers pay approximately $1,166 more per year — $4,142 compared to Brooklyn’s $2,976. Several factors drive the gap, including variations in state law between New York and New Jersey. Brooklyn also has cheaper insurance than Jersey City, with an average annual premium of $3,738.
New Jersey is a choice no-fault state in which drivers elect the limitation-on-lawsuit option.
Perhaps more importantly, in 2026, New Jersey state law increased the minimum liability requirements to 35/70/25, raising bodily injury liability from $25,000 per person and $50,000 per accident while keeping property damage liability unchanged at $25,000.
Sophie’s Tip
It’s normal for the ‘cheaper’ city in a pair like this to change from year to year — rates follow local claims and risk, not a fixed rule about which city always costs more. It’s worth comparing current quotes for your specific address rather than assuming last year’s pattern still holds.
Rate gap: Los Angeles vs. Long Beach, California
The gap between average rates in Los Angeles and Long Beach, a city just 20 miles away, is $562 per year. Los Angelenos pay an average of $4,383 per year, largely due to the city’s population density and extreme traffic congestion compared with Long Beach. With a population of more than 3.6 million, Los Angeles is eight times the size of Long Beach, which has an annual rate of $3,821.
See the rate gap in other U.S. cities in the table below.
| City | Premium | City | Premium | $ Difference |
|---|---|---|---|---|
| Brooklyn, NY | $2,976 | Jersey City, NJ | $3,738 | $762 |
| Detroit, MI | $4,928 | Warren, MI | $4,679 | $249 |
| Brooklyn, NY | $2,976 | Newark, NJ | $4,142 | $1,166 |
| Detroit, MI | $4,928 | Dearborn, MI | $5,213 | $285 |
| Los Angeles, CA | $4,383 | Long Beach, CA | $3,821 | $562 |
| Los Angeles, CA | $4,383 | Pasadena, CA | $4,048 | $335 |
| Dallas, TX | $3,426 | Fort Worth, TX | $3,049 | $377 |
| Chicago, IL | $2,373 | Evanston, IL | $2,030 | $343 |
| Chicago, IL | $2,373 | Oak Park, IL | $2,150 | $223 |
| San Francisco, CA | $3,976 | Daly City, CA | $3,836 | $140 |
| Seattle, WA | $2,803 | Bellevue, WA | $2,603 | $200 |
| Tacoma, WA | $2,941 | Seattle, WA | $2,803 | $138 |
| Miami, FL | $4,672 | Fort Lauderdale, FL | $4,871 | $199 |
| Miami, FL | $4,672 | Hialeah, FL | $4,518 | $154 |
| San Francisco, CA | $3,976 | Oakland, CA | $4,026 | $50 |
Insurance ‘deserts’: Where drivers struggle to find affordable coverage
In insurance “deserts,” drivers face challenges finding affordable and sometimes even available car insurance.
These areas lack access to property and casualty insurance because insurers have either reduced their presence or priced their coverage prohibitively expensive. It can leave residents with limited choices, excessively high premiums and, in some cases, the inability to get a policy.
Several factors contribute to the creation of insurance deserts. Geographic location is a key determinant because insurers assess risk based on an area’s crime rates, traffic congestion and frequency of accidents.
In urban areas with higher rates of vehicle theft, vandalism and collisions, insurance companies may raise premiums or withdraw from the market entirely, citing the high cost of claims. Climate change is also playing a role. Areas prone to natural disasters like floods, wildfires or hurricanes are seeing insurers pull back as the risk of catastrophic loss becomes too high to be profitable.
“Weather is a huge factor,” Ruiz says. “You see more accidents in bad weather. As climate risk increases with more severe winter storms, hail and flooding that impact insurance rates.”
High insurance costs can make it difficult for drivers in insurance deserts to afford a policy, which is legally required in every state except New Hampshire.
Resources & Methodology
Sources
- Council for a Better Louisiana. “Understanding the High Costs of Louisiana Auto Insurance.” Accessed September 2026.
- Nevada Department of Public Safety. “Nevada Traffic Safety Crash Facts.” September 2026.
- Michigan Department of Insurance and Financial Services. “Choosing PIP Medical Coverage.” September 2026.
- Insurance Information Institute. “What determines the price of an auto insurance policy?” September 2026.
- PwC. “Climate risk and insurance: the case for resilience.” September 2026.
- Rocky Mountain Insurance Information Institute. “Cost of Auto Insurance.” September 2026.
- Smart Choice. “Insurance Deserts: Strategies for Agents in High-Risk Areas.” September 2026.
Methodology
CarInsurance.com’s analysis combines insurance rate data from Quadrant Information Services with internal research to calculate premiums for 40-year-old male and female drivers with a full-coverage policy, limits of 100/300/100 and $500 deductibles for comprehensive and collision coverage.
This methodology is developed and regularly updated by CarInsurance.com’s data and editorial team to ensure that premium comparisons at the city and ZIP level are consistent and unbiased. Read the detailed methodology for more information.

 Still have a question? Ask our experts
Get advice from an experienced insurance professional. Our experts will help you navigate your insurance questions with clarity and confidence.
Browse all FAQs